
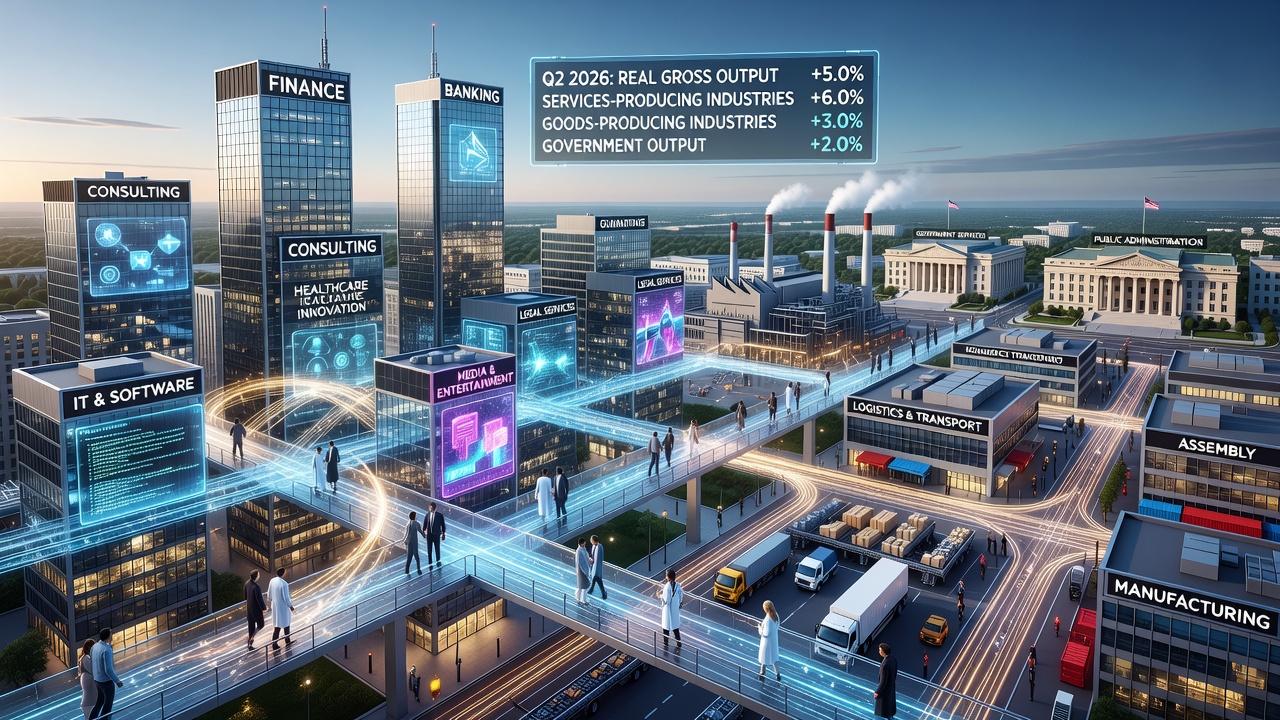
The US economy's underlying production engine accelerated sharply in the second quarter of 2026, with real gross output climbing 5.0 percent. This measure, broader than GDP, tracks the full value of transactions across the economy, including business-to-business sales that never show up in final consumption figures. The gain was led by private services-producing industries, which expanded 6.0 percent, while private goods-producing industries grew 3.0 percent and government output rose 2.6 percent.
Why Gross Output Tells a Different Story Than GDP
Gross domestic product measures only the value of goods and services sold to final users - consumers, businesses investing in capital, governments, and foreign buyers. Gross output captures something additional: the intermediate transactions that happen before a product or service reaches that final stage. A software company selling cloud infrastructure to a bank, a logistics firm moving components between factories, a marketing agency billing another business - all of this activity counts in gross output but is stripped out of GDP to avoid double-counting. That makes gross output a more complete picture of supply-chain activity and a useful early indicator of where economic momentum is building or fading.
Services Sector Outpaces Goods and Government
The 6.0 percent increase in private services-producing industries stands out as the strongest contributor to the quarter's growth. Services industries span a wide range of activity, from finance and professional services to healthcare, information technology, and entertainment. Their outsized gain relative to goods-producing industries, which rose 3.0 percent, reflects a pattern that has defined much of the post-pandemic economy: services have generally recovered and expanded faster than manufacturing and other physical-goods sectors, partly because supply chains for services are less exposed to the logistical bottlenecks and input-cost pressures that have periodically constrained goods production.
Government's More Modest Contribution
Government output grew 2.6 percent, the slowest of the three major categories. Government gross output includes the value of services provided by federal, state, and local agencies, measured largely by the cost of inputs such as employee compensation and purchased goods, since government services are not sold in a market the way private output is. A comparatively modest increase here suggests that public-sector activity expanded at a steadier, more incremental pace than the private sector during the quarter, consistent with the typically slower-moving nature of government budgets and staffing levels compared with private business decisions.
Reading the Numbers in Context
Gross output figures matter beyond academic interest. They inform how economists, policymakers, and business analysts assess the depth of economic expansion - whether growth is concentrated in final consumer spending or distributed across the full chain of production that supports it. A quarter in which gross output outpaces GDP growth, as this data implies by capturing more transactional layers, often signals that intermediate business activity - the unglamorous but essential work of supplying other businesses - is contributing meaningfully to overall momentum. For sectors tied to digital services, financial technology, and consumer platforms, this kind of data offers a reminder that growth in final consumer-facing numbers can understate the breadth of economic activity happening behind the scenes.